Instructors: Lara Grant and Liza Stark
Date: Wednesday, April 4, 9:30-12 pm
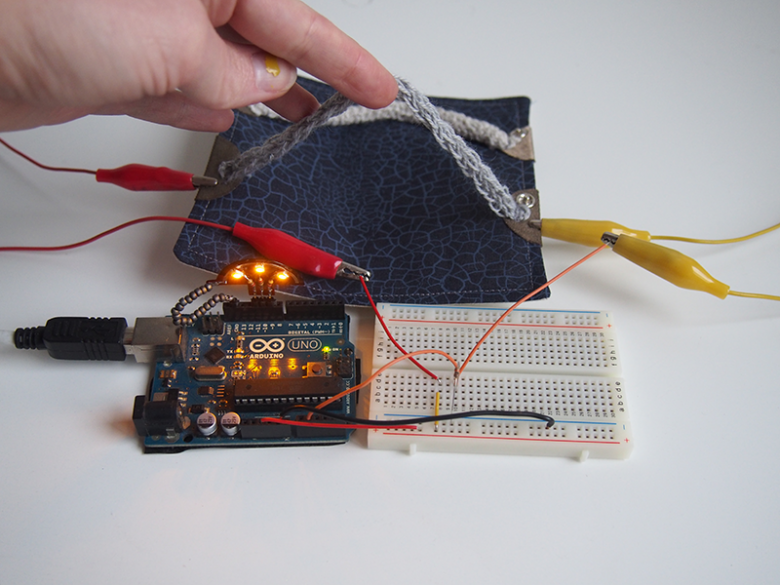
Soft sensors are great for custom projects, but sometimes it can be difficult to get stable readings from your sensors. This workshop will be part hands-on activity and part group discussion on how we all deal with those jumpy sensor readings. Liza and Lara will go over basics like the smoothing and calibration sketch in Arduino and bring snippets of code to share. We also want to explore how to make this weakness into a strength. Materials for sensor-making will be available. Bring your data processing techniques, your fav sensors, and your Arduino! No prior knowledge is necessary.
//////////////////////
Purpose of the workshop:
- Share what you have used
- Go over smoothing and calibration in Arduino
- Graph and compare some raw sensor data and filtered data using common filter formulas
- Compare and contrast how filters work on different e-textile sensors. Record and document as a reference for others.
- Brainstorm how jumpy readings can be advantageous
Participant goals
- Sam – Smoothing accelerometer data; already working with a bunch of things pieced together
- Victoria – Intro to sensors
- Emilia – Making pressure sensors; optimal reading
- Sophie – Reliable pressure sensor data over time and in real time; data processing for analog sensors; scaling up – working with multiple sensors
- Taeyoon – Ways of mixing digital and analog sensors; other tricks for textile
- Erica – See the data that you want vs how to see in a certain range
Participants shared ways of processing sensor data:
Sophie Skach – Processing data from embedded e-textile sensors in pants to identify gestures and motion.
Anastasia Pistofidou – The project TOMO uses Swept Frequency Capacitive Sensing (SFCS) a concept explored by Disney Research Labs on this paper.
Plotting sensor data
Using the Arduino Serial Plotter
Plotting in Processing and Max/MSP
Recording your sensor data
When recording sensor data while testing each filter it’s useful to record the follow:
Sensor Type | Active Material | Resting Value | Active Value | Screen Capture of Plotted Raw | Screen Capture of Plotted Filtered
Filters
Included in the Arduino IDE
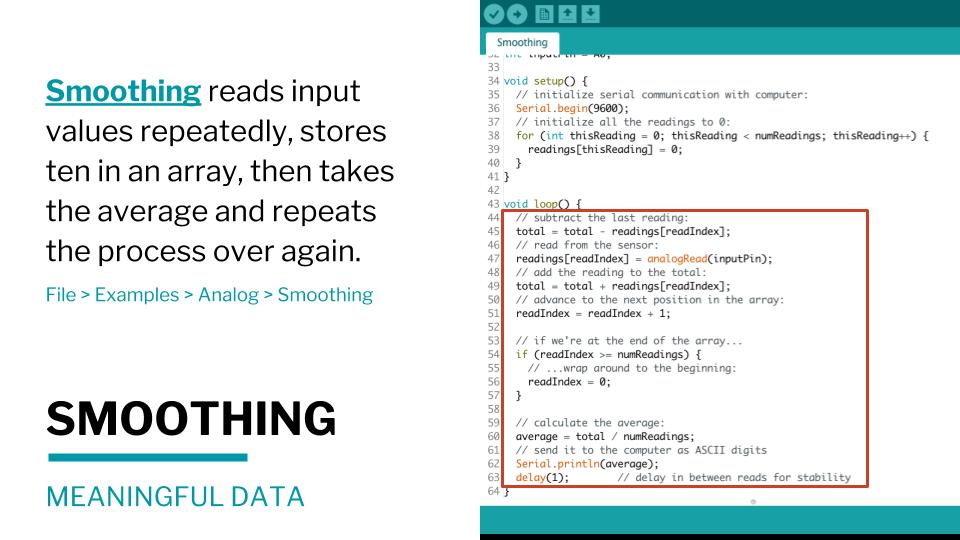
- Smoothing – is a running average filter
Smoothing with added raw value variable to compare to average
|
1 2 3 4 5 6 7 8 9 10 11 12 13 14 15 16 17 18 19 20 21 22 23 24 25 26 27 28 29 30 31 32 33 34 35 36 37 38 39 40 41 42 43 44 45 |
const int numReadings = 10; // number of samples int readings[numReadings]; // the readings from the analog input int readIndex = 0; // the index of the current reading int total = 0; // the running total int average = 0; // the average const int inputPin = A2; // Analog input void setup() { // initialize serial communication with computer: Serial.begin(9600); // initialize all the readings to 0: for (int thisReading = 0; thisReading < numReadings; thisReading++) { readings[thisReading] = 0; } } void loop() { // subtract the last reading: total = total - readings[readIndex]; // read from the sensor: int raw = analogRead(inputPin); readings[readIndex] = raw; // add the reading to the total: total = total + readings[readIndex]; // advance to the next position in the array: readIndex = readIndex + 1; // if we're at the end of the array... if (readIndex >= numReadings) { // ...wrap around to the beginning: readIndex = 0; } // calculate the average: average = total / numReadings; // send it to the computer as ASCII digits Serial.print(raw); Serial.print(" "); Serial.println(average); delay(10); // delay in between reads for stability } |
10 sample window with 1 ms delay 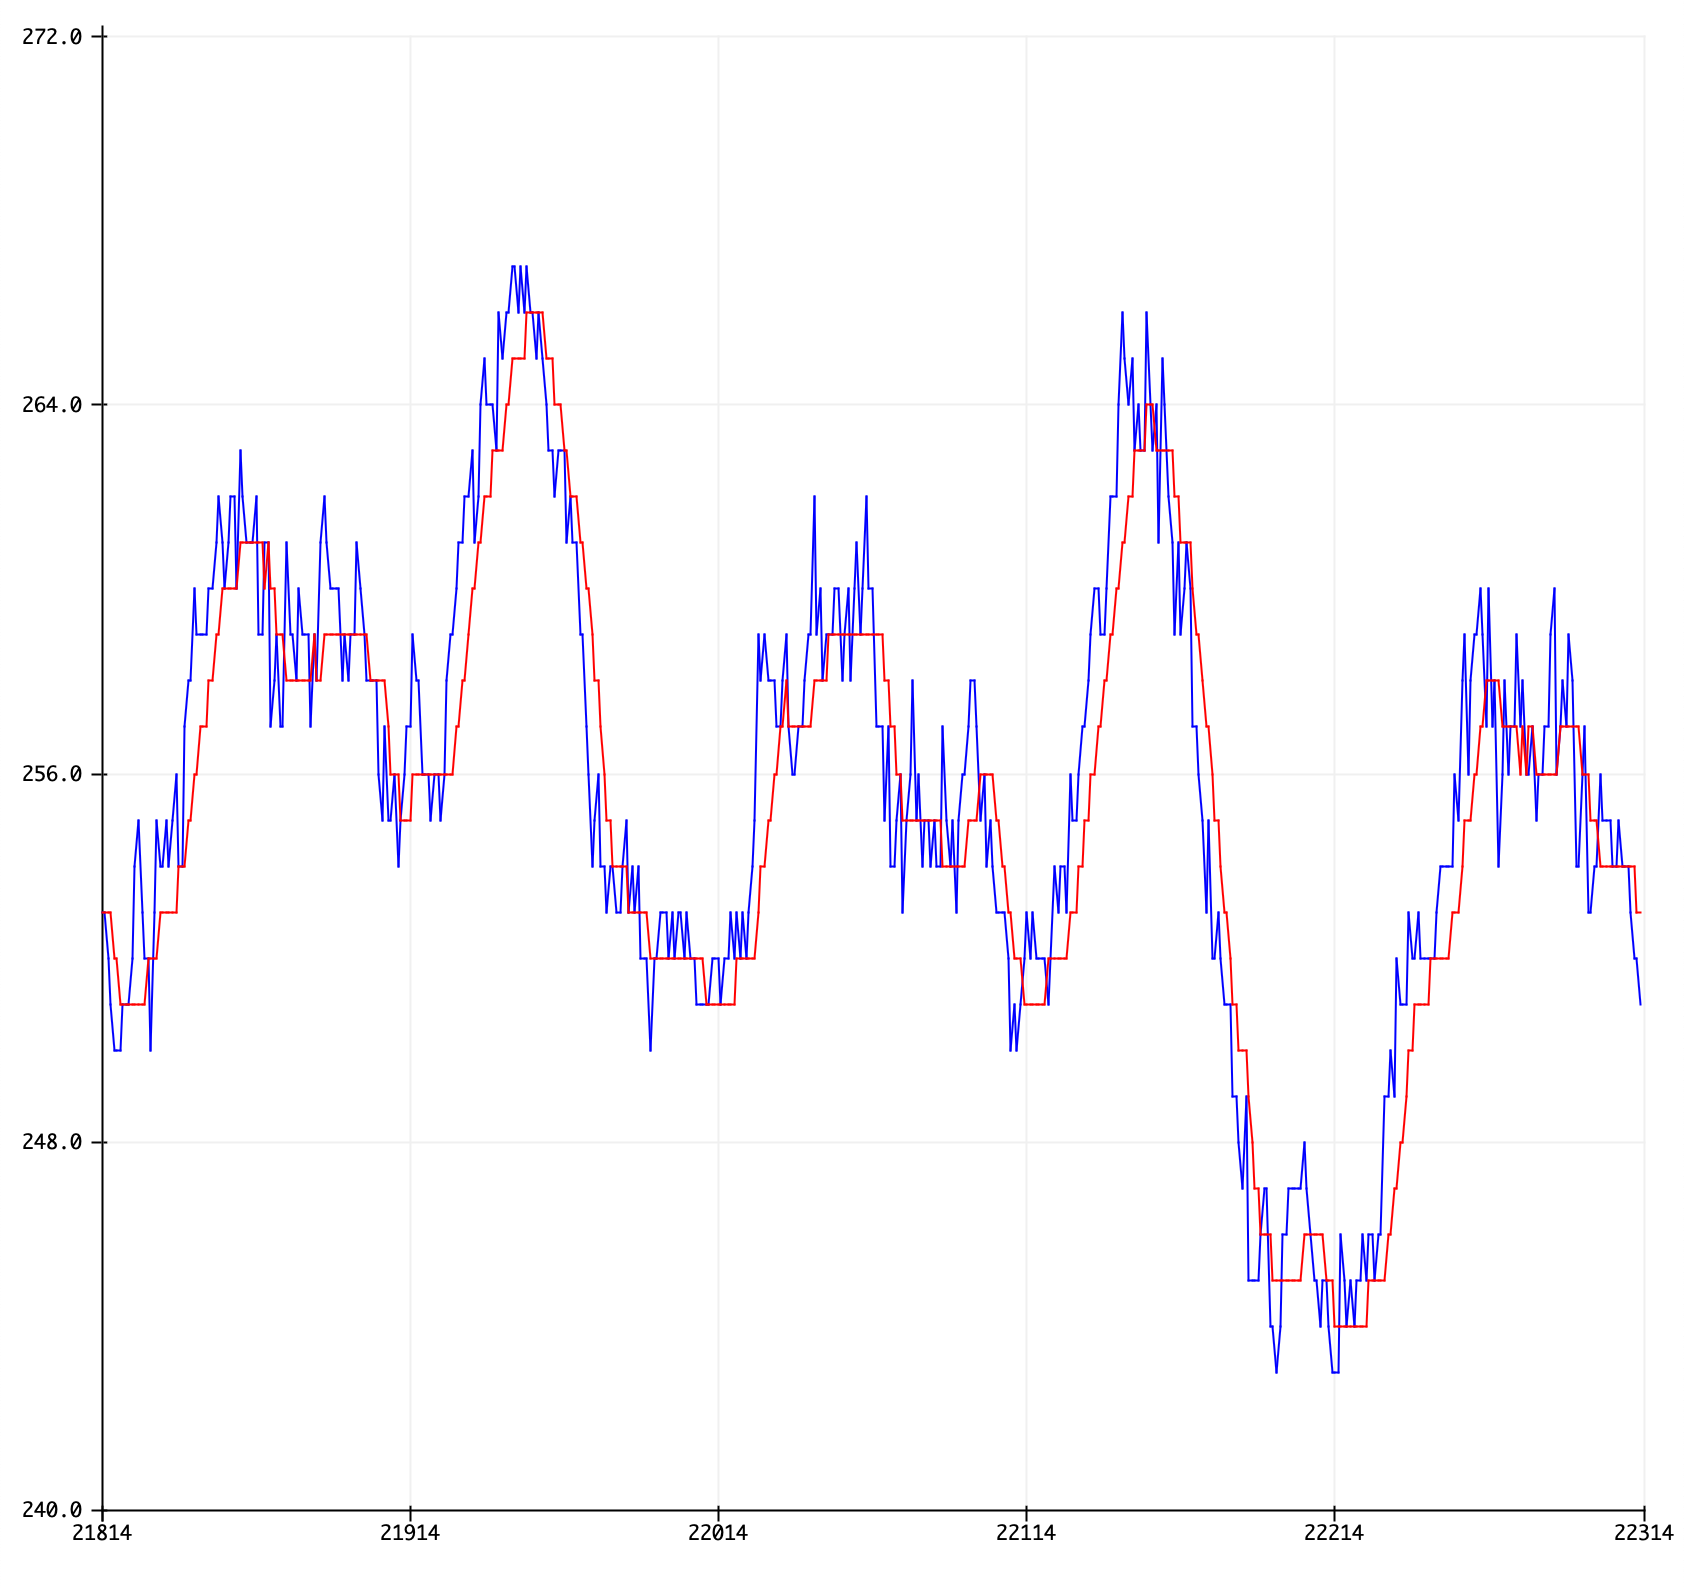
50 sample window with 10 ms delay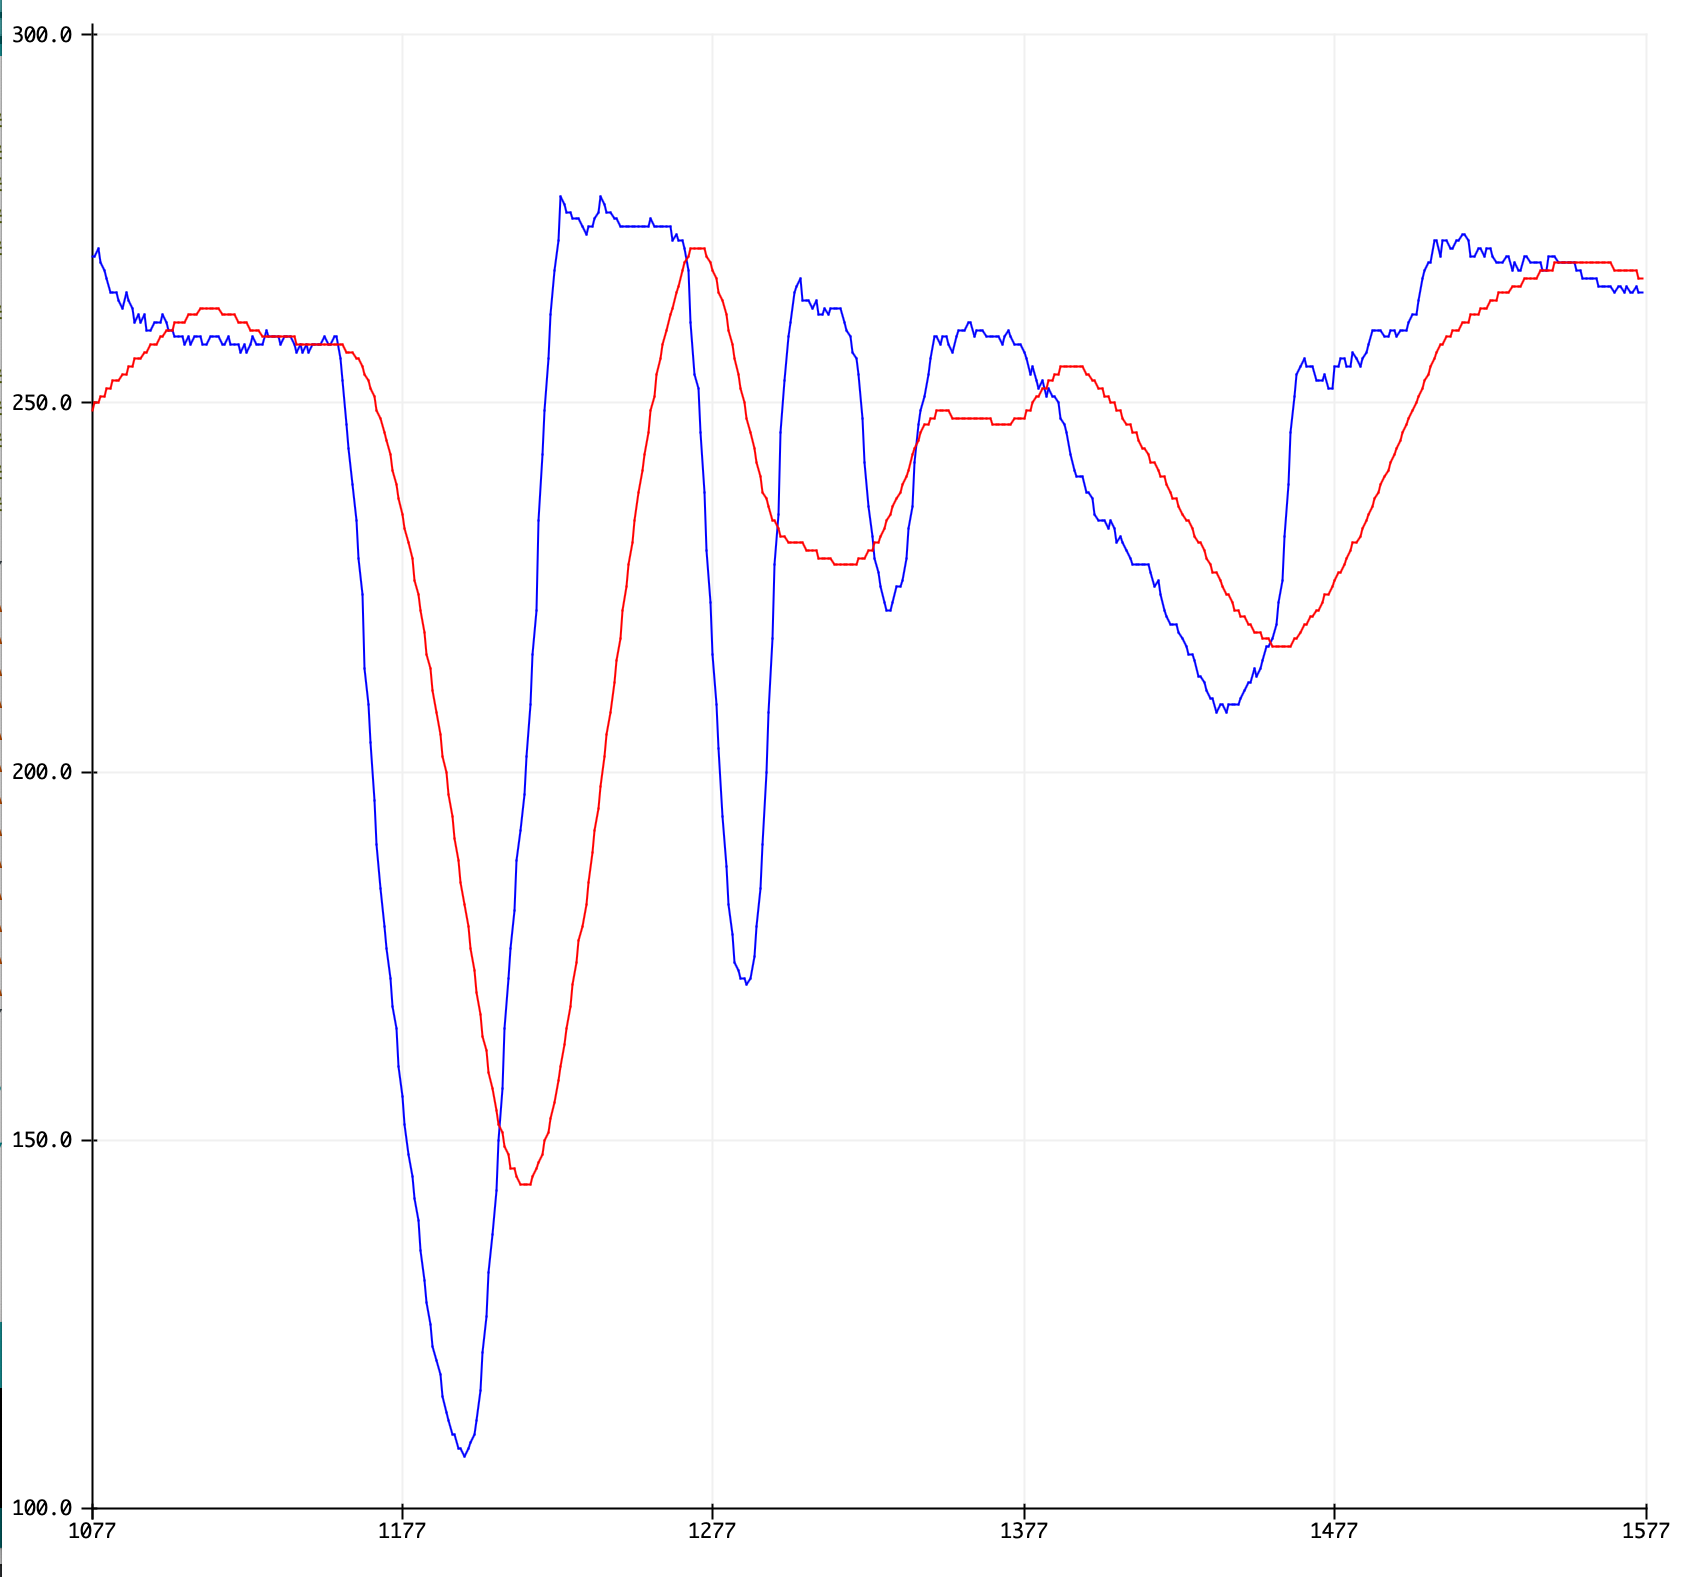
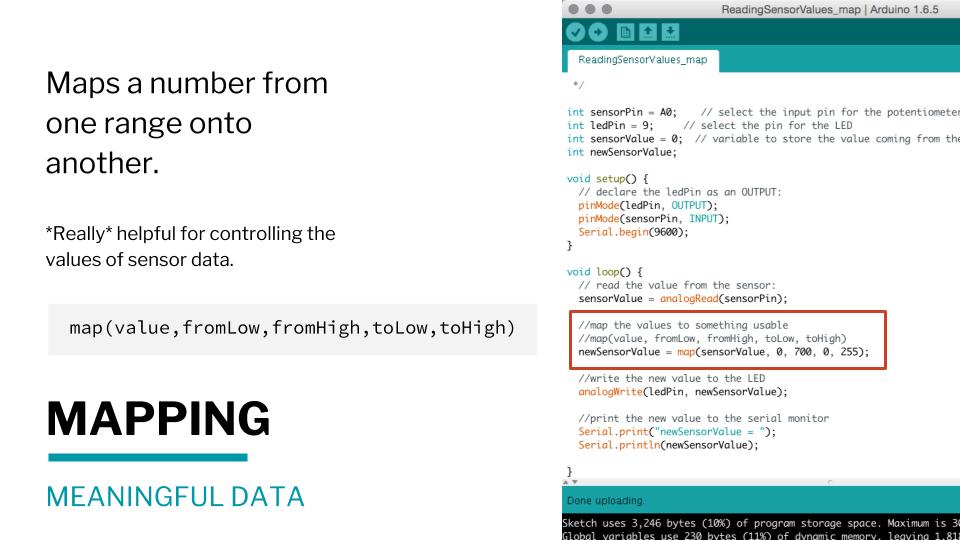
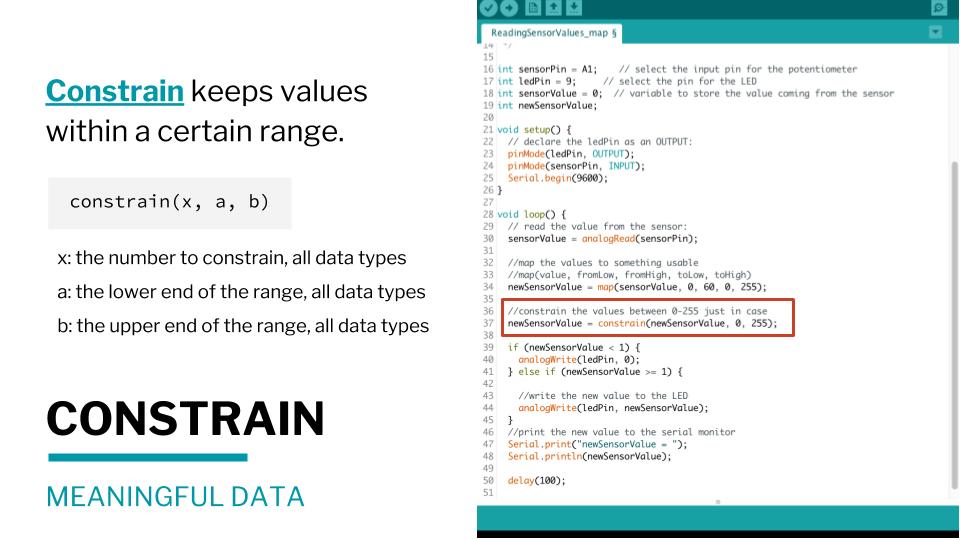
- Calibration – isn’t a filter, automatically sets minimums and maximums

|
1 2 3 4 5 6 7 8 9 10 11 12 13 14 15 16 17 18 19 20 21 22 23 24 25 26 27 28 29 30 31 32 33 34 35 36 37 38 39 40 41 42 43 44 45 46 47 48 49 50 51 52 53 54 55 56 57 58 59 60 61 62 63 64 65 66 67 68 69 70 71 72 73 74 75 76 77 78 79 80 81 82 83 84 85 86 87 88 89 90 91 92 93 94 95 96 97 98 99 100 101 102 103 104 105 106 107 108 109 110 111 112 113 114 115 116 117 118 119 120 121 122 123 124 125 126 |
/* STRETCH SENSOR TEST SKETCH Liza Stark May 2018 This sketch reads a Eeontex stretch/bend sensor. It incorporates smoothing and calibration examples by Mellis and Igoe. The sensor is attached to A1 through a 10k voltage divider. */ // Define the number of samples to keep track of. The higher the number, // the more the readings will be smoothed, but the slower the output will // respond to the input. Using a constant rather than a normal variable lets // use this value to determine the size of the readings array. const int numReadings = 10; // average number of readings int readings[numReadings]; // the readings from the sensor int readIndex = 0; // the index of the current reading on the sensor int total = 0; // the running total for the sensor int average = 0; // the average for the sensor int sensor = A1; // sensor pin // Calibration variables int sensorValue = 0; int sensorMin = 1023; //this is supposed to be higher int sensorMax = 0; //this is supposed to be lower void setup() { // initialize serial communication with computer: Serial.begin(9600); /* This is the calibration part of the sketch. Once you upload it, open your serial monitor and follow the instuctions. You can aomment this out once you have your sensor calibrated */ // turn on LED to signal the start of the calibration period: pinMode(13, OUTPUT); digitalWrite(13, HIGH); // initialize all the readings on the sensor to 0: for (int thisReading = 0; thisReading < numReadings; thisReading++) { readings[thisReading] = 0; } Serial.println("Calibration beginning"); Serial.println("Take deep breaths until the LED goes off"); // calibrate during the first five seconds while (millis() < 5000) { sensorValue = analogRead(sensor); // record the maximum sensor value if (sensorValue > sensorMax) { sensorMax = sensorValue; } // record the minimum sensor value if (sensorValue < sensorMin) { sensorMin = sensorValue; } // print values for debugging Serial.print("Max = "); Serial.print(sensorMax); Serial.print("\t"); Serial.print("Min = "); Serial.println(sensorMin); } // signal the end of the calibration period digitalWrite(13, LOW); Serial.println("Calibration ending"); //End comment } void loop() { // READ VALUES COMING IN FROM THE SENSOR - Take average of 10 readings // subtract the last reading: total = total - readings[readIndex]; // read from the sensor: readings[readIndex] = analogRead(sensor); // add the reading to the total: total = total + readings[readIndex]; // advance to the next position in the array: readIndex = readIndex + 1; // if we're at the end of the array... if (readIndex >= numReadings) { // ...wrap around to the beginning: readIndex = 0; } // calculate the average: average = total / numReadings; // print the original average for debugging Serial.print("Average = "); Serial.print(average); Serial.print("\t"); // map the average value to the min and max we recorded above average = map(average, sensorMin, sensorMax, 0, 255); // constrain the values within a certain range average = constrain(average, 0, 255); // print the new average for debugging Serial.print("New Average = "); Serial.println(average); delay(1); // delay in between reads for stability } |
Exponential Moving Average – Video
|
1 2 3 4 5 6 7 8 9 10 11 12 13 14 15 16 17 18 19 |
//Global Variables int sensorPin = A2; //pin number to use the ADC int raw = 0; //initialization of raw sensor variable, equivalent to EMA Y float EMA_a = 0.6; //initialization of EMA alpha int EMA_S = 0; //initialization of EMA S void setup(){ Serial.begin(9600); //setup of Serial module, 9600 bits/second EMA_S = analogRead(sensorPin); //set EMA S for t=1 } void loop(){ raw = analogRead(sensorPin); //read the sensor value using ADC EMA_S = (EMA_a*raw) + ((1-EMA_a)*EMA_S); //run the EMA Serial.print(raw); Serial.print(" "); Serial.println(EMA_S); //print digital value to serial delay(50); //50ms delay } |
Low-Pass Filter
Source for circuit
RC Low-pass filter circuit

Source for sketch
|
1 2 3 4 5 6 7 8 9 10 11 12 13 14 15 16 17 18 19 20 21 22 23 |
const float alpha = 0.5; double data_filtered[] = {0, 0}; const int n = 1; const int analog_pin = 0; void setup(){ <span class="skimlinks-unlinked">Serial.begin(9600</span>); } void loop(){ // Retrieve Data data = analogRead(analog_pin); // Low Pass Filter data_filtered[n] = alpha * data + (1 - alpha) * data_filtered[n-1]; // Store the last filtered data in data_filtered[n-1] data_filtered[n-1] = data_filtered[n]; // Print Data Serial.println(data_filtered[n]); delay(10); } |
High-Pass Filter
Source for circuit
RC High-pass filter circuit

Source for sketch
|
1 2 3 4 5 6 7 8 9 10 11 12 13 14 15 16 17 18 19 20 21 22 23 |
//Global Variables int sensorPin = A2; //pin number to use the ADC int sensorValue = 0; //initialization of sensor variable, equivalent to EMA Y float EMA_a = 0.3; //initialization of EMA alpha int EMA_S = 0; //initialization of EMA S int highpass = 0; void setup(){ Serial.begin(9600); //setup of Serial module, 9600 bits/second EMA_S = analogRead(sensorPin); //set EMA S for t=1 } void loop(){ sensorValue = analogRead(sensorPin); //read the sensor value using ADC EMA_S = (EMA_a*sensorValue) + ((1-EMA_a)*EMA_S); //run the EMA highpass = sensorValue - EMA_S; //calculate the high-pass signal Serial.print(sensorValue); Serial.print(" "); Serial.println(highpass); delay(20); //20ms delay } |
Kalman Filter library by Denys Sene
Download from GitHub and install
Kalman filter
- Prediction step
- Estimation step
|
1 2 3 4 5 6 7 8 9 10 11 12 13 14 15 16 17 18 19 20 21 22 23 24 25 26 27 28 29 30 31 32 33 34 35 36 37 38 39 40 41 42 43 44 45 46 47 48 49 50 51 |
#include <SimpleKalmanFilter.h> /* This sample code demonstrates how to use the SimpleKalmanFilter object. Use a potentiometer in Analog input A0 as a source for the reference real value. Some random noise will be generated over this value and used as a measured value. The estimated value obtained from SimpleKalmanFilter should match the real reference value. SimpleKalmanFilter(e_mea, e_est, q); e_mea: Measurement Uncertainty e_est: Estimation Uncertainty q: Process Noise */ SimpleKalmanFilter simpleKalmanFilter(10, 10, 0.01); // Serial output refresh time const long SERIAL_REFRESH_TIME = 5; long refresh_time; int pin = 20; int ground = 21; void setup() { Serial.begin(9600); pinMode(ground, OUTPUT); digitalWrite(ground, LOW); pinMode(pin, INPUT_PULLUP); } void loop() { // read a reference value from A0 and map it from 0 to 100 float real_value = analogRead(pin); // calculate the estimated value with Kalman Filter float estimated_value = simpleKalmanFilter.updateEstimate(real_value); // send to Serial output every 100ms // use the Serial Ploter for a good visualization if (millis() > refresh_time) { Serial.print(real_value,4); Serial.print(","); Serial.print(estimated_value,4); Serial.println(); refresh_time = millis() + SERIAL_REFRESH_TIME; } } |


///////
Filters Arduino library – download
- Low-pass
- High-pass